December 10, 2012
- in Uncategorized by schooloftrade
Crude Oil day trading plan

| Crude Oil day trading plan |
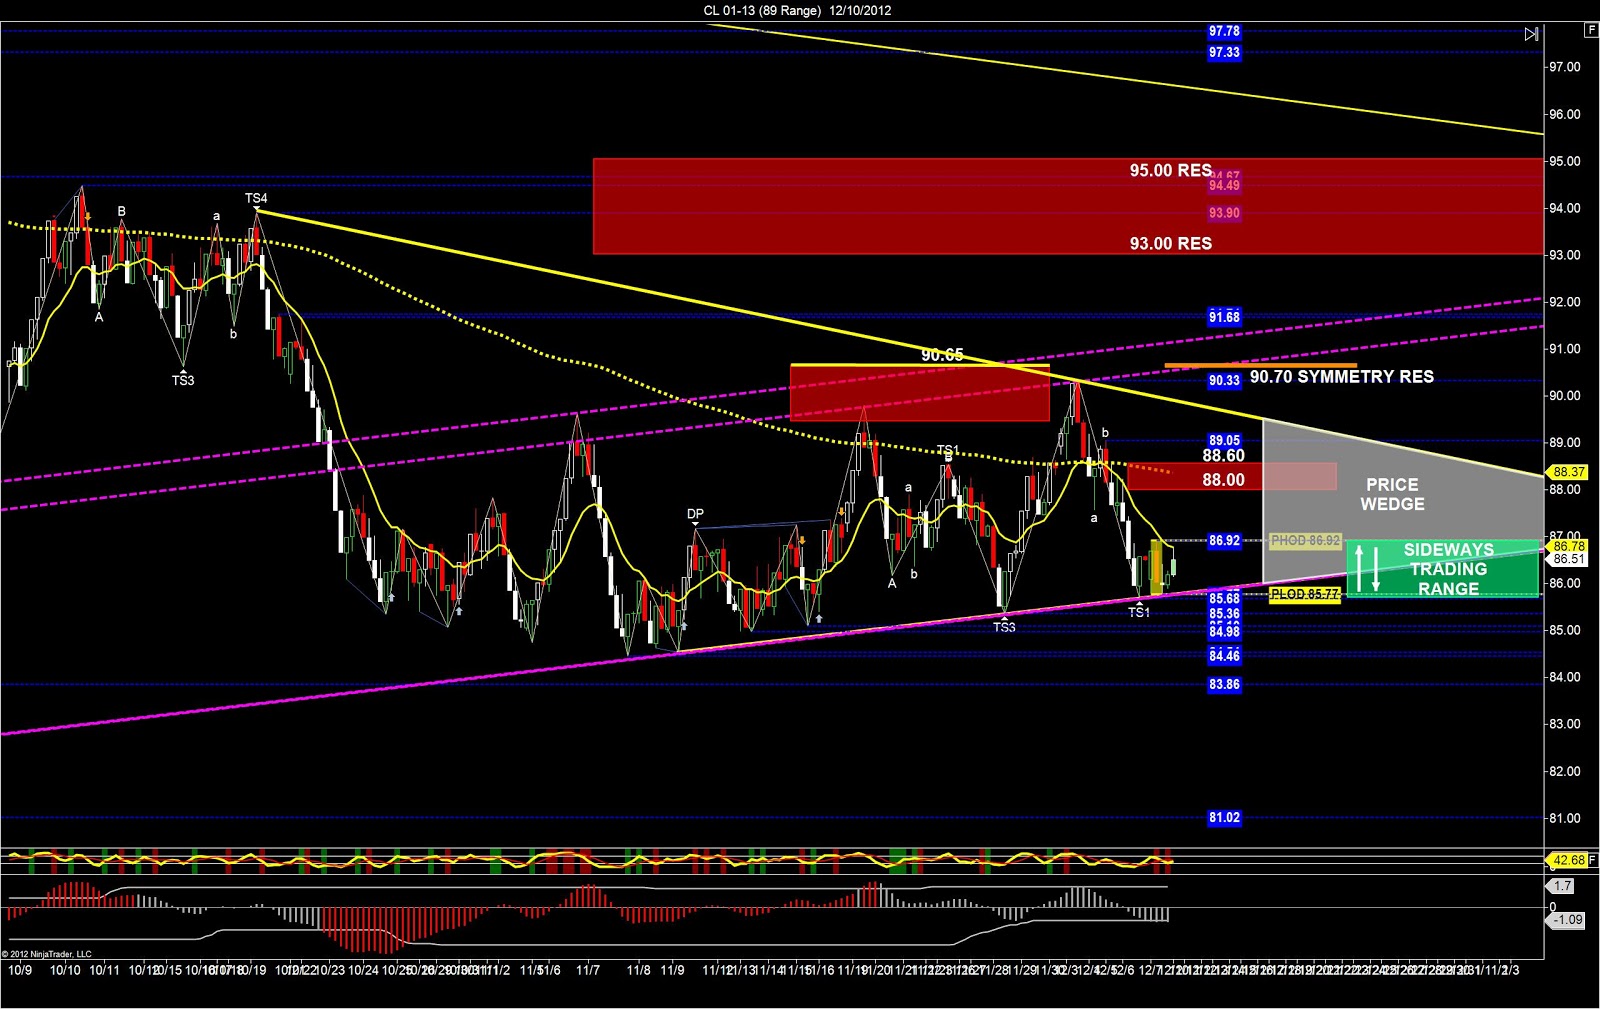
We can see price-action
on Crude Oil trading sideways all the way at the lows of the price-wedge and
the trading range. This tells us a big
clue this morning that when price falls to the lows of this sideways-trading-range
we want to buy because we’re also at the price-wedge lows.
on Crude Oil trading sideways all the way at the lows of the price-wedge and
the trading range. This tells us a big
clue this morning that when price falls to the lows of this sideways-trading-range
we want to buy because we’re also at the price-wedge lows.
The high-percentage-trades
will be to buy the lows of this price-wedge.
If price-action pushes to new lower-lows below 85.68 we first look for
the fake-out-breakout giving us a price-reversal and another opportunity to buy
when the sellers fail to keep it moving lower.
We may also need to adjust our strategy if the sellers are too strong
and we see nothing but bearish price-action.
If this occurs we look for the wave-pattern-short below major resistance
(which turns into support) and we get short with sellers.
If price
moves higher this morning the first thing we’re doing is selling the PHOD 86.92
as resistance. This resistance is also
the highs of the sideways-trading-range.
We always want to sell the highs of ANY trading range. If price-action keeps moving higher and
pushes above the PHOD we first look for the fake-out-breakout and then we buy pullbacks
using the wave-pattern-long above the PHOD.
As price
rises higher we are buying pullbacks above the PHOD and using the profit-target
of 88.00 and 88.60 overhead.
rises higher we are buying pullbacks above the PHOD and using the profit-target
of 88.00 and 88.60 overhead.