February 27, 2013
- in Uncategorized by schooloftrade
Crude Oil Anchor Chart Prep

 |
| Crude Oil Anchor Chart Prep |
Crude Oil is
trading in the middle of the long term bearish price-channel, along with the
middle of the short term trading range this morning.
trading in the middle of the long term bearish price-channel, along with the
middle of the short term trading range this morning.
We need to
stay patient and wait for the test of the highs or the lows of the trading
range. On Tuesday this week we saw price-action
at the PLOD and it resulted in a HUGE volatility trading session, and today is
the complete opposite. Beware this type
of market personality ahead of Crude Oil Inventories @ 1030am EST and know when
to sit-on-hands.
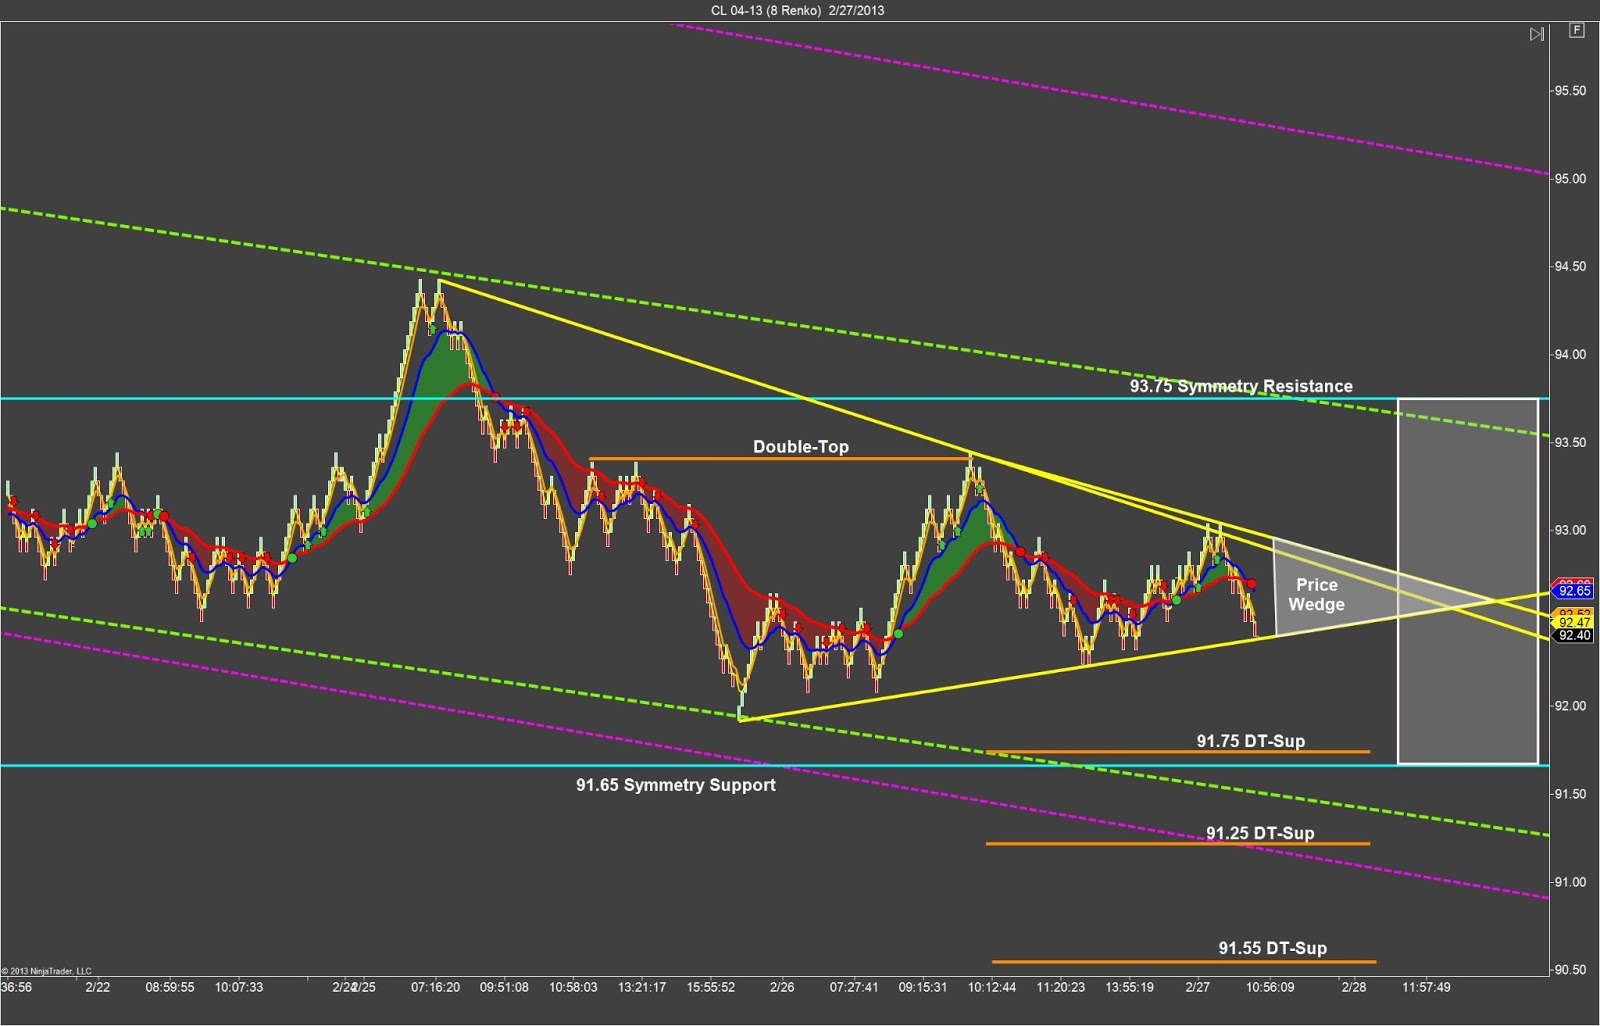
Our anchor
chart gives us easy symmetry support below us and resistance above us to allow
us to look for price-reversal around each of these levels. We can also see the double-top support levels
starting at 91.75, 91.25 and 91.55 and we will be looking for a price-reversal around
these support levels followed by a long entry signal.
Our day
trading plan for Crude Oil is to stay patient with the sluggish market
personality ahead of Crude Oil news @ 1030am EST today. We can see a clear consolidation of price-action
and we have a price-wedge to prove it.
As price falls to support at the lows we will buy, and as price rises to
the highs at resistance we will sell.
Furthermore, if the price-action makes a new higher-highs or lower-lows I
will be looking for a fake-out-breakout and will then wait for a price-reversal
and then take the trade back into the price-wedge.
 |
| Crude Oil ENTRY Chart Prep |
For example,
if we break to new lower-lows below the price-wedge I’m looking for the sellers
to exhaust and then I will buy the re-entry back into the price-wedge at the
lows. Furthermore, if price-action was
to test the double-top support at 91.75 that is an ideal location for a price-reversal
followed by a entry signal long and a final profit-target on the buy-order back
up into the price-wedge at the highs.