May 3, 2011
- in Uncategorized by schooloftrade
Biggest Day of 2011 Day Trading Crude Oil and Gold Futures

We already completed the Crude Oil on the Morning prep, now let’s review the Gold Futures.
89Range chart on the 06-11 GC shows us the following:
– We just broke the MAJOR bullish trend line (the lows of the price channel)
– Price Wedge in pink trend lines
– Sideways Range(s) inside of sideways range(s) in the white boxes
This chart focuses our attention on these three important aspects today. Now lets use a faster timeframe and find the exact price levels we need to use today:
34range chart shows us:
– No definite dollar correlation, we will look for that later this morning, but nothing at this time
– We are trading below the major bullish price channel in yellow trend lines 1558.6
– We see a price wedge and we want to buy the lows and sell the highs of the wedge
– We see three sideways ranges, and the PHOD/PLOD is above/below us so these ranges become even MORE important.
– The very wide range from PHOD down to PLOD makes this an inside trading day, but with such wide ranges, its almost like an outside day, but better!
– “we have some strong price magnets”
– Major levels above us include 51.4, 58.6, 59.6, 65.2, 67.1, 75.8, 77.4 and we are selling these levels first, and if we see new highs above these levels we then look to buy pullbacks.
– We don’t buy the highs, we buy pullbacks AFTER new highs.
– Major levels us support below us include 34.8, 32.1, 22.7, 17.1, 16.2, and we are buying support first, and with new lower lows we then sell retracements.
– The big money trigger line (BMT) is a very sloppy area when its flat and in the middle of the range
– We want to avoid trading around the bmt, ideally, we want price to rise up, so I can sell resistance levels and take profit back down at this BMT. Or vice versa.
–
830am est
– We see the gold market is starting to trade very narrow inside this wide range above and below us.
– Our plan of attack on Gold this morning:
o If prices rise:
§ Im selling the highs of the range 48.7, 51.4
§ I also need to beware trading around the P-OPEN at 49.8, it will always be sloppy around the OPEN
o If prices fall:
§ Im buying the lows of the range at 37.1, 36.1 LOD, and 34.8 the lows of the range
§ The BMT is a sloppy area, so avoid trading around the BMT.
– Our plan of attack on crude oil today:
o We notice the bearish price channel on the 13range chart, so let’s use this as our guide
o If prices rise:
§ I’m selling resistance levels at 112.66, beware the OPEN at 112.80 and the BMT at 112.91
§ The higher we go, the more challenging the areas become, this may also be why price is moving in that direction…to find shelter.
§ The 113.00 area appears to be very challenging, so we will look to trade carefully around the big round number 113.00
o If prices fall:
§ I’m buying support levels below me 111.89 the LOD and the lows of the wedge
§ I need to be careful trading around the pink trend line (lows of the wedge)
§ I want to buy the lows of the wedge, but the exact price level is TBD
§ If we make new lows below the lows of the wedge I will then look to sell retracements.
o
930am est
– We took 100 ticks out of crude oil after trying to sell with a wave short, and then we bought the lows of the wedge and bought pullbacks on the way up.
– Now its 930am we have 10am news to watch out for and the plan of attack is as follows:
– It appears (34range) that crude oil tried to rise into the BMT at 112.75 but failed and now we see the big inverted hammer pattern which confirms we MAY see prices come back down to the lows of the wedge.
– We already have a very distinct bearish channel, it makes sense for price to try and get back to new lows
– We look and see very sloppy price action around the 113.00 area so beware!
– If prices rise on crude oil:
o We need to beware the 113.00
o We need to avoid the bmt at 112.72
o It does NOT look very fun until price can break above 113.20
o Sell the HOD 113.12, sell 113.20 range highs
o I will also buy pullbacks as we make new higher highs
– If prices fall on crude oil:
o Selling below the support at 112.41 (34r trigger line)
o Im buying support at the lows of the range and the lows of the wedge
o Buying 112.00, 111.91, 111.72, and if we make new lower lows I will also sell retracements.
945am est
– We notice the personality is changing
– Getting much slower
– Trading around the BMT’s on the Crude Oil
– Around the big round number of 113.00 on crude oil
– We tried to sell the crude oil after seeing it fail at the 113.0 level but the market is clearly changing its direction, or trying to find direction
– Very sloppy at this point on crude oil
1030am est
– We just grabbed 100 ticks out of gold in less than 35 minutes
– We followed our plan, gold was at the lows of the wedge, we bought the lows for an easy winner
– We then saw the lows of the wedge break so we sold a retracement (FT Winner)
– We then saw the sellers dry up, we then bought the entry long above the lows of the wedge
We’re having a great day so far, but its only 1030am, so beware the DEAD ZONE between the final news event and the European Close @ 1130am
Lets plan our attack on Gold:
– We’re in the middle of the wedge
– We’re right next to the BMT
– All the BMT’s are flat and the same area, so beware
– If price rises:
o I’m selling resistance first, then buying pullbacks at new higher highs
o I’m selling 1542.2, 45.9, sell the highs of the wedge
o Im being very careful around the 1548.2 up to 49.8
o Im selling the HOD 1551.4
o Im then buying pullbacks with new highs above the HOD
– If prices Fall:
– I’m buying support levels first, then selling retracements with new lower lows
– Buy the wedge lows and the lows of the trading range
– Buying
12:00pm EST
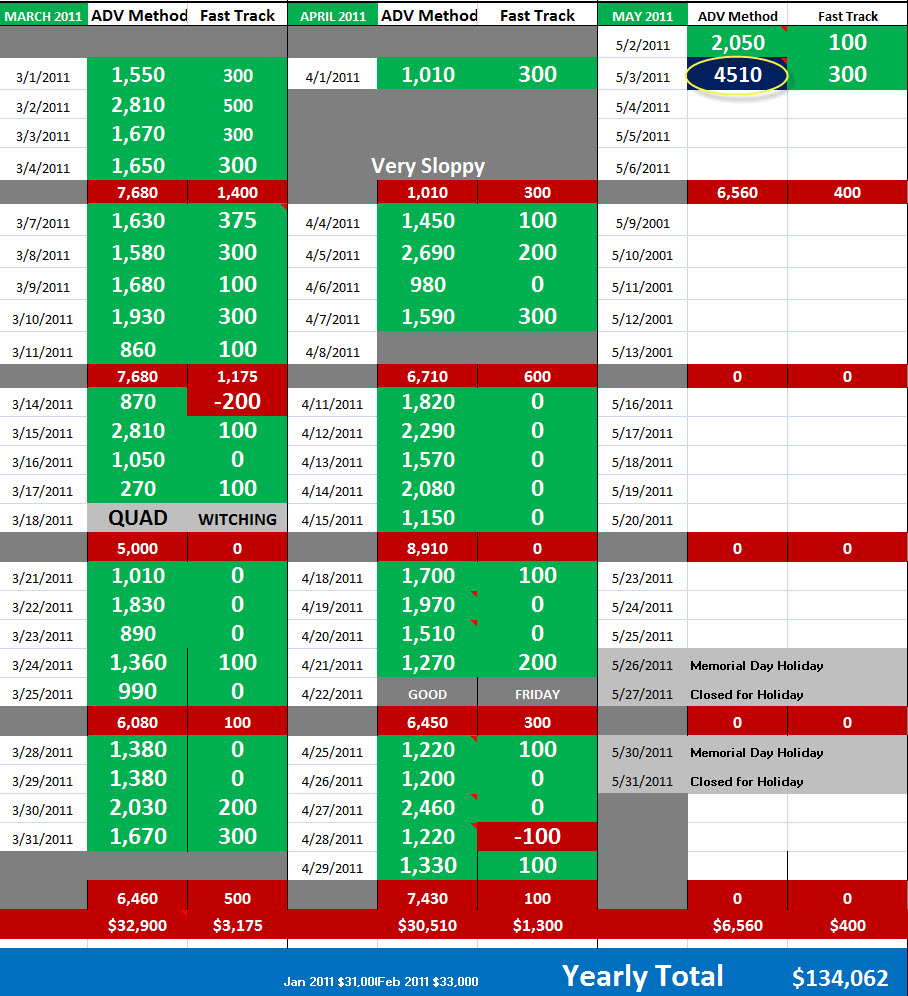
– We’ve had the biggest day of the year today
– We think we followed our rules, but lets review the morning prep and see if we really knew what we we’re talking about:
– Lets start with crude oil:
– What did my morning prep tell me to do?
o Slight upward trend on the dollar this morning has me ‘watching’ the short side of the market early, but that can quickly change, but it is there to be seen.
o If price drops im buying the lows of the wedge 111.89, buying the lows of the sideways range 111.00, and buying the PLOD 110.82
o If price rises I will avoid trading around the BMT, and will sell resistance at the highs of the wedge 114.50, highs of the sideways range 114.83/115.00 and the PHOD 114.83.
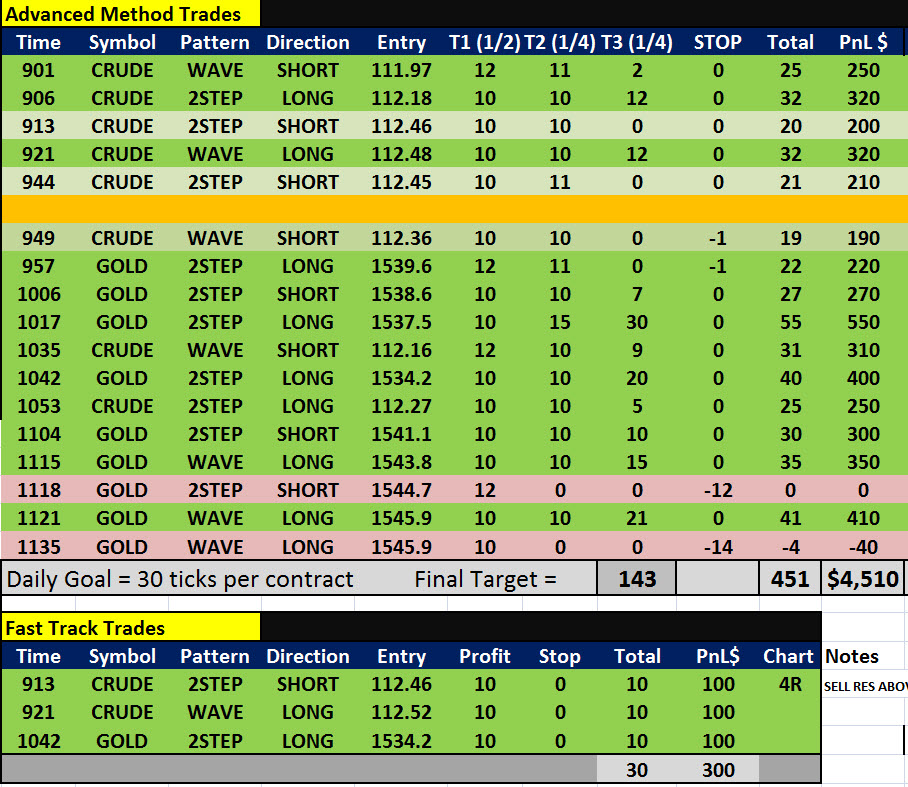
– What did we actually do?
– 900: using the rising dollar and the bearish channel we sold a retracement
– 906: at the lows of the wedge, we buy the lows of the wedge
– 913: not according to our plan, but it is known as a VERY high % trade
–
– 921: bought the wedge lows, buy pullbacks to continue this move
– 944: not according to the plan, but very high % trade, sell highs above bear channel
– 949: not according to plan, selling the highs was ok, but we should have waited
– 1035: sold the wedge highs
– 1053: buy wedge lows
– It looks like as always, the trades that did not go with our plan, were winners, but they are not the big winners like we saw when we did follow the plan.
Lets wrap up the day on gold:
– What did our morning prep tell us?
o We see a price wedge and we want to buy the lows and sell the highs of the wedge
o Inside day, so buy the lows and sell the highs (sideways ranges)
o Avoid the BMT areas
– What did we trade today?
o 957: buy the wedge lows
o 1007: sold the buyers failing (not according to the plan, but very high %)
o 1017: new lower lows below the wedge lows, so sell retracement, following our plan!
o 1042: buying the lows of the wedge again…re entered into the wedge from the lows
o 1104: Selling the highs the wedge, follow the plan!
o 1115: new higher highs above the wedge highs so we use a 4range chart to buy pullbacks with new highs
o 1118: not with the plan, tried to sell in the middle of the range, assumedly from buyers failing (LOSS, against the plan)
o 1121: new higher highs above the wedge highs and we buy pullbacks
o 1135: did not fit our RULES, flat trigger, slowing speed, and of course, it’s a loss.
Click Here To Review Our Automated Trading Results From This Morning