- in Uncategorized by schooloftrade
Bad News can’t stop Equities ahead of OPEX | SchoolOfTrade Newsletter 02/20/14


make you a living; self-education will make you a fortune.”
Today:
Market’s Today:
OPEX
in full effect! (sloppy)
Crude
Oil; 76-ticks (-0.03%) @ 102.87
Gold;
182-ticks (+0.93%) @ 1323.0
Mini-Russell;
205-ticks (+0.96%) @ 1158.7
News Today:
China
& EUR Manufacturing; LOWER
Jobless
Claims; FLAT (336k)
Philly
Fed Survey; LOWER (-6.3)
This Day In History:
that Fed Govt has more power than individual states
New York to Chicago, opening the West of the United States
Earth
medal as youngest person ever (Age 15)
News Tomorrow
OPEX
Friday ALL Day
EUR: Retail Sales @ 4:00am EST
CAD: Retail Sales @ 830am EST (Crude Oil)
US:
Existing Home Sales @ 10am EST
 |
| Friday’s News |
Tomorrow brings the end
of OPEX, the third week of the month, with options expiring at the end of the
day on Friday. Traders from around the world will be making
any final adjustments to their portfolios early tomorrow morning, and we expect
the volume to be light tomorrow until the end of the morning when we should see
some volatility kick-up as ‘desperation trades’ hit the tape before end of the
session.
The news in the US
session is very light tomorrow, usually we don’t have any news at all on OPEX-Friday, but
tomorrow we do have news in the US from Existing Home Sales at 10:00am EST.
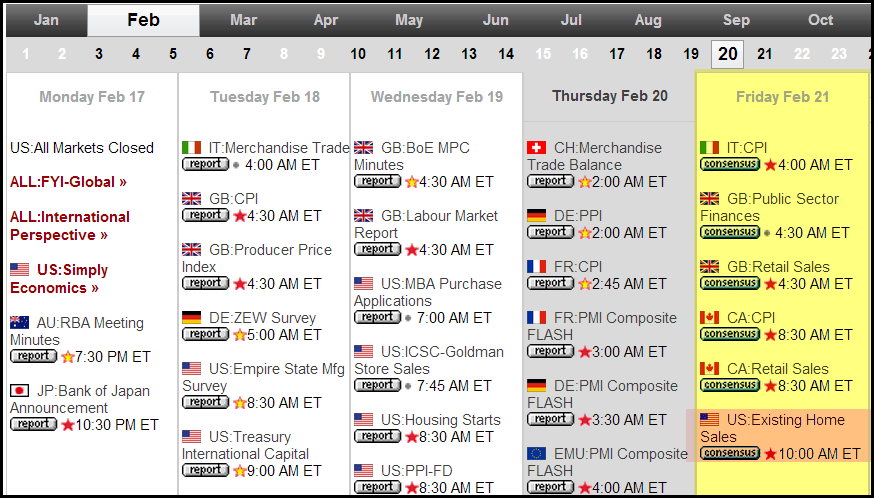
The big news on the
schedule comes from Europe and Canada early tomorrow morning.
First, we have Consumer Price & Retail Sales numbers being released
in Europe starting at 4:00am EST.
Sales reported from Canada tomorrow at 8:30am EST which will likely kick-up some volatility on
commodities such as Crude Oil, natural gas, etc.
4:00am EST: Consumer
Price Index (EUR)
4:30am EST: Retail
Sales (EUR)
8:30am EST: Retail
Sales (CAD)
10:00am EST: Existing
Home Sales (US)
Day trading plan for Tomorrow:
Crude Oil:
VIP Chart:
 |
| Crude Oil VIP Chart |
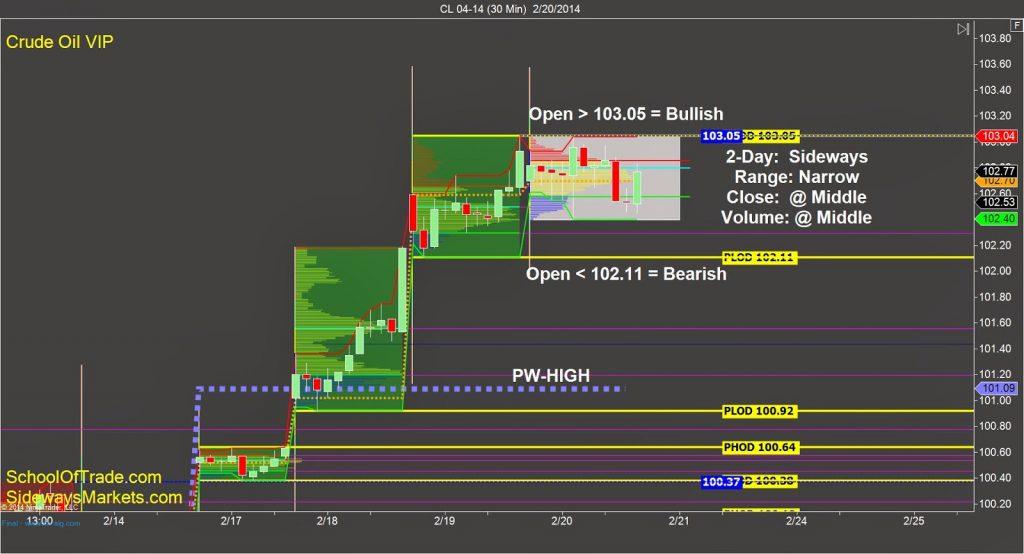
We’re trading sideways on Crude Oil this evening with our
second day in a row of trading inside the previous day’s range. This type of market-personality cannot
continue for much longer… other markets are moving like wildfire… so what’s the
hold-up on Crude Oil?
My plan for Friday is
to look for buying opportunities above the 103.05, along with selling
opportunities below the 102.11. If we
get short below 102.11 I’m looking for a profit-target down at the prior week’s
lows at 101.09.
Anchor Chart:
 |
| Crude Oil 34 Anchor Chart |
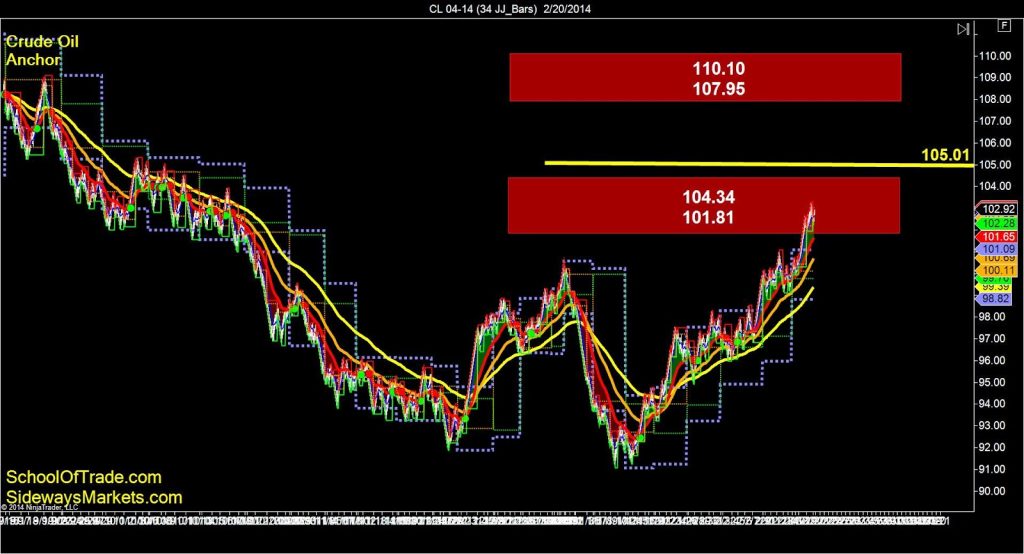
We can see Crude Oil pushing into some major resistance around
101.81 up to 104.34, which explains why price-action has been stuck just below
the 103.00 big-round-number this week.
This 34-anchor chart shows us well-overbought and running into resistance
which suggests that price will move LOWER before it moves HIGHER.
 |
| Crude Oil 21 Anchor Chart |
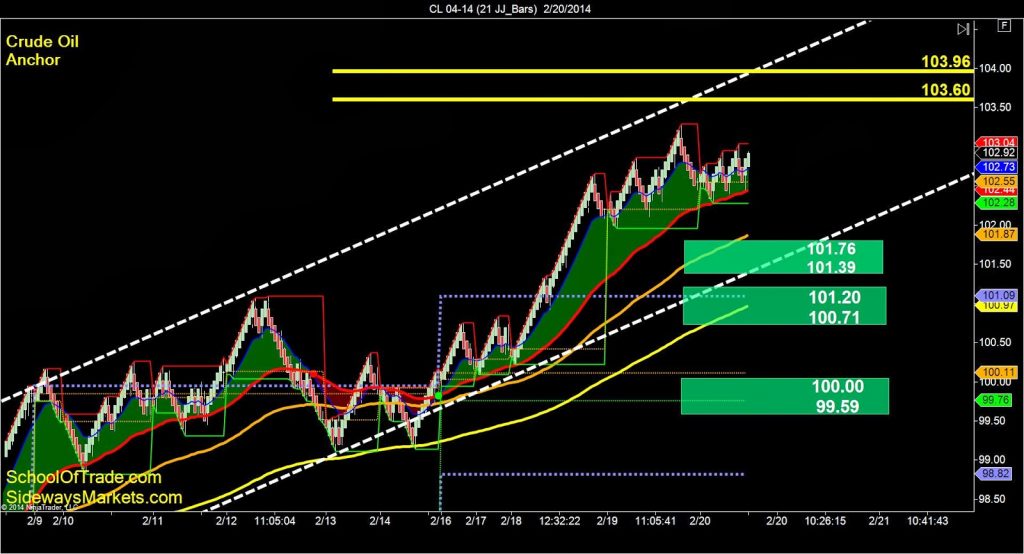
The 21-anchor chart of Crude Oil shows us clearly very
bullish. We can see the bull price
channel, higher-highs and higher-lows, along with a green ‘cloud’ above all the
key moving-averages. All of these clues
tell me to look for buying opportunities this evening and tomorrow…HOWEVER…I don’t
want to buy at a premium so I will be looking for buying opportunities after Crude
Oil pulls back.
I would LOVE to buy the
support zone at 101.76 on the way up to a profit-target at 103.60.
The 13-anchor chart of Crude Oil shows us the most important
details this evening and into tomorrow.
We can see 2 bullish price channels on this chart, along with a key buy-zone
down around 102.24-102.11.
 |
| Crude Oil 13 Anchor Chart |
I want to buy the lows
of this price channel around 102.60, and will definitely look for buying
opportunities at the 102.24 if we can be so lucky. I have profit-targets overhead at 103.09,
103.27, 103.62, and 103.98 and all the way up at 104.45. If price-action moves below 102.11 I will
then look to sell short.
Gold:
VIP Chart:
 |
| Gold VIP Chart |
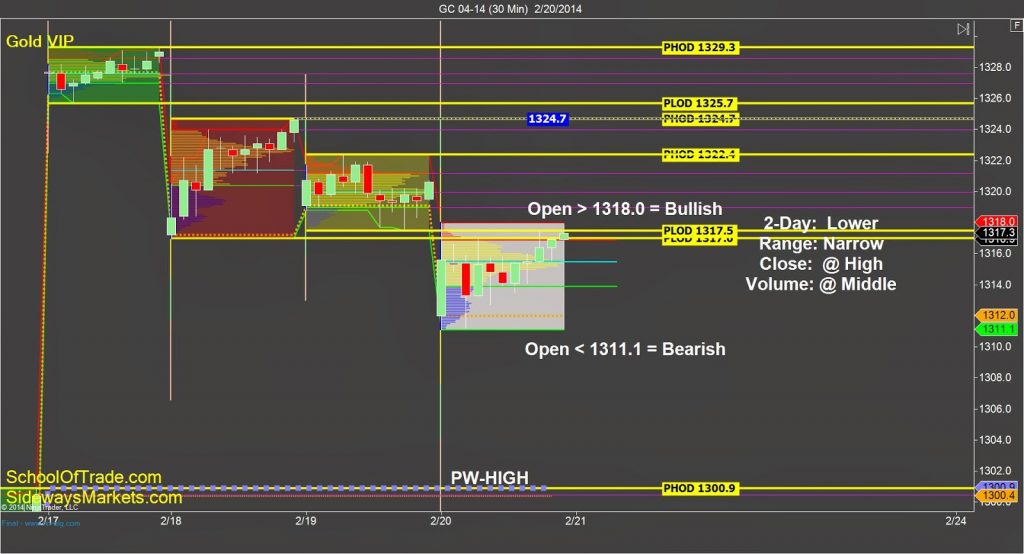
Gold has been fun to trade this week, even if this price-action
doesn’t make much sense to us right now…who cares…making money doesn’t always
have to make sense! Today we had a
gap-down at the opening-bell but the US traders scooped it up and pushed it
right back to where the day ended on the prior day, suggesting that we may have
a bullish move back up to 1324.7 on Friday.
I am looking for buying
opportunities above the 1318.0 with a profit-target at 1324.7, and selling
opportunities below the 1311.1 with a profit-target down at 1300.9.
Anchor Chart:
 |
| Gold 34 Anchor Chart |
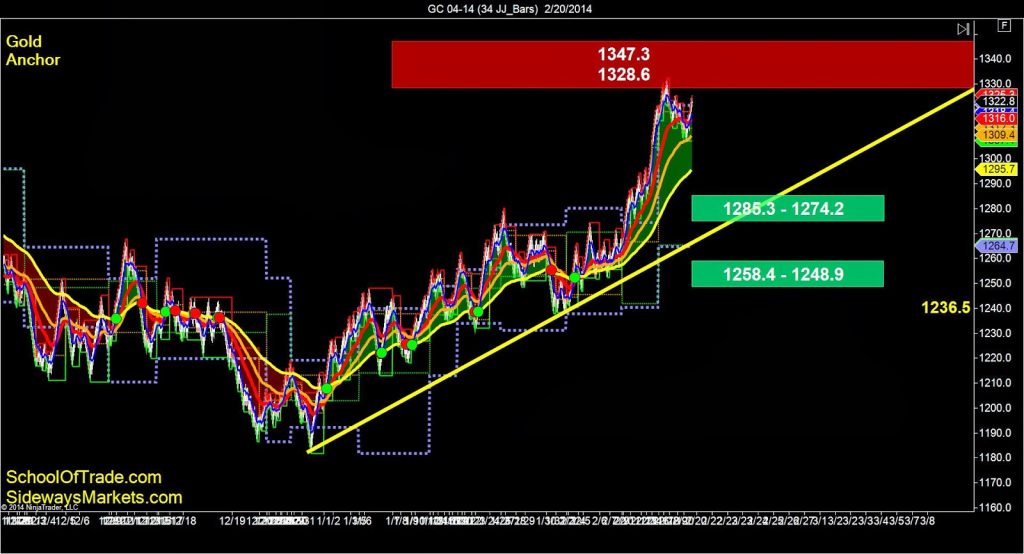
Gold is trying to push itself through a major resistance zone
overhead right now on the 34-anchor chart.
We can see resistance up at 1328.6 and 1347.3 is standing in our way if
the buyers want to keep pushing higher. We
can also see some excellent buying opportunities down at 1285.3 which is not on
a buy-zone but also a key trend-line support level.
 |
| Gold 21 Anchor Chart |
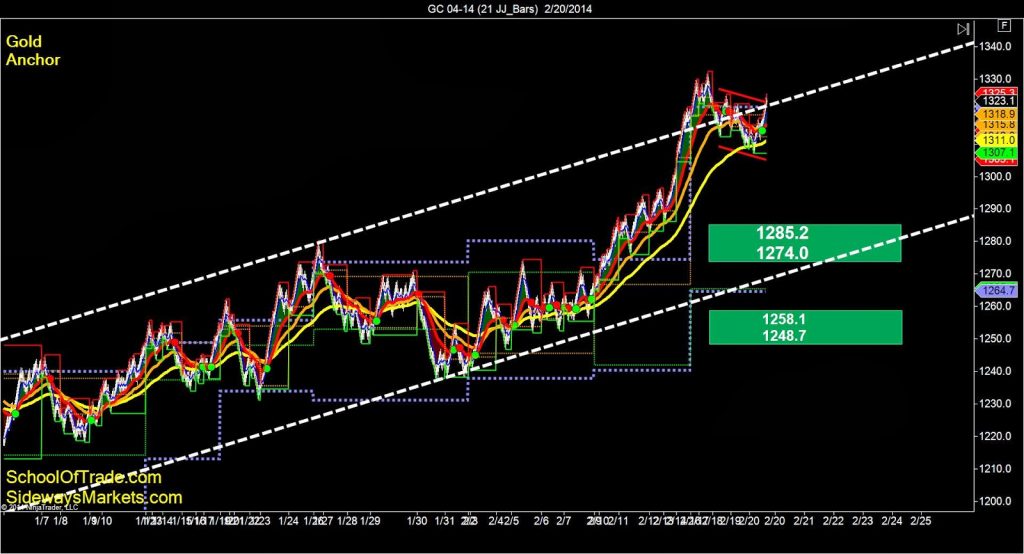
The 21-anchor chart of Gold shows us more bullish clues this
evening. We can see the long-term
bullish price channel, but more importantly we can see the buyers have run this
price-action all the way up to the HIGHS and the sellers have started to grab
control after we assume people starting taking profit at these highs.
Look closely and you
can see a key buy-zone down at 1285.2 which would be a great place to load-up
on some gold if we can get down there in the next 24 hours.
 |
| Gold 13 Anchor Chart |
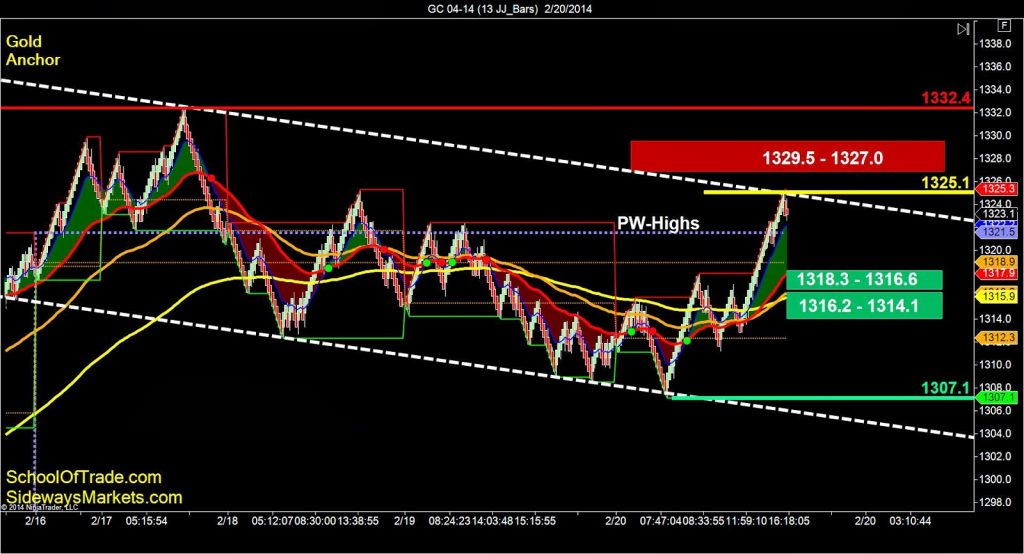
Gold throws us a “curve-ball” on the 13-anchor chart this evening. First, we can see the long term bearish price
channel and we are trading at the highs this evening which is a very strong resistance
location on this chart. Second, we can
see today’s price-action pushed Gold higher above the key moving-averages and
giving us higher-highs and higher-lows.
These are conflicting clues for this evening so we need to be careful.
My goal is to sell
these highs of the bear price channel in the short-term, taking profit at
1318.3 and 1307.1. In addition, I am
going to look for buying opportunities at the 1318.3 and 1316.2 levels as price
goes lower and I will use the levels of 1325.1 and 1327.0 as profit-targets
overhead.
Mini-Russell:
VIP Chart:
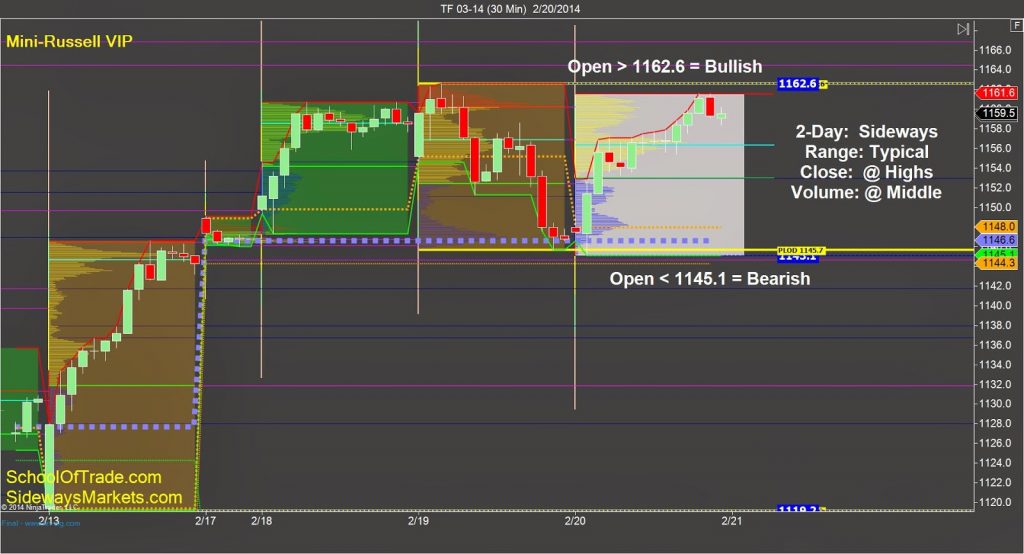 |
| Russell VIP Chart |
The Mini-Russell has been trading inside the same trading-range
all week since we started after the holiday on Monday. This week has been incredible for day trading
because you can see that price-action went from top to bottom, then back up to
the top again over the last 3 sessions, giving us ample amount of trading
opportunities during our Live Trade Room.
My goal is to look for buying
opportunities above the 1162.6, along with selling opportunities below the
1145.1 with a profit-target short down at 1119.2 lows from last Friday.
Anchor Chart:
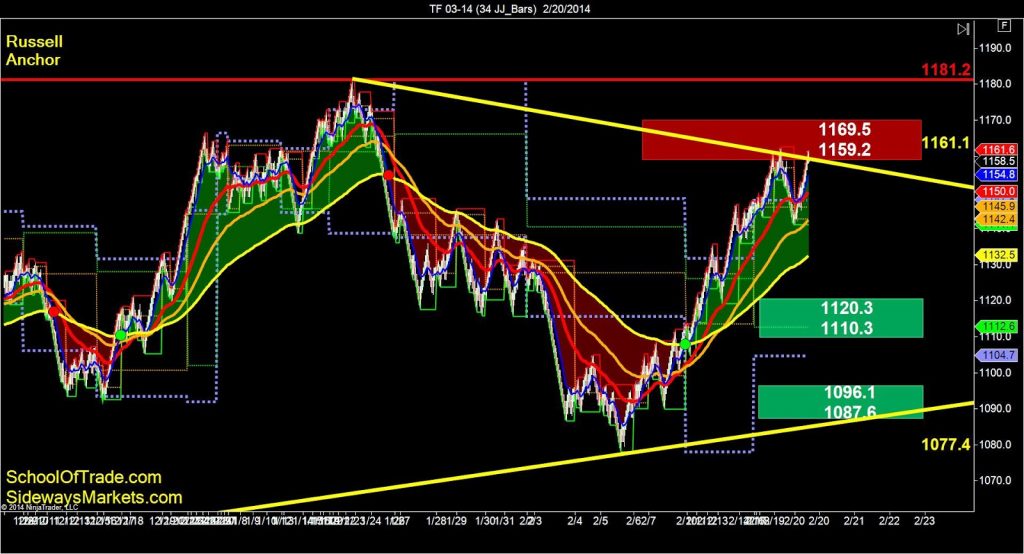 |
| Russell 34 Anchor Chart |
The 34-anchor chart of the Mini-Russell shows us trying to
break through this resistance for a second time this week. We have a major sell-zone above us at 1159.2
up to 1169.5 along with a resistance trend-line. I want to be a seller at this trend-line and sell-zone
so I will be watching closely to see how tomorrow’s opening-bell looks and
considering selling short from there.
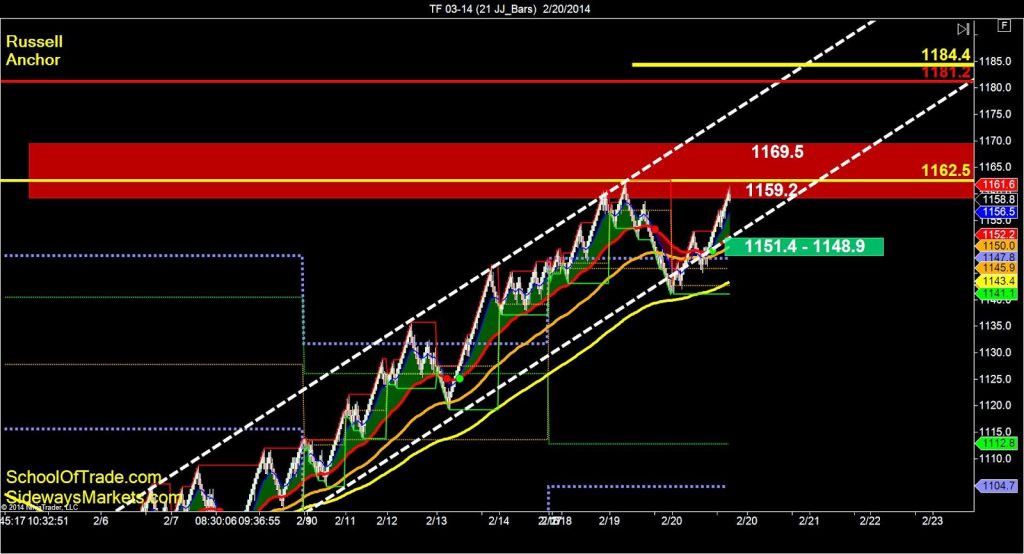 |
| Russell 21 Anchor Chart |
The 21-anchor chart shows us trading higher inside a
long-term bullish price channel so we want to use the LOWS of this price
channel for buying opportunities this evening and into tomorrow. Look closely and you can see that there is a major
resistance level above at 1162.5 and we just tested it and pulled off the resistance.
I want to buy the Mini-Russell
if we can get down to the 1151.4 buy-zone this evening or tomorrow.
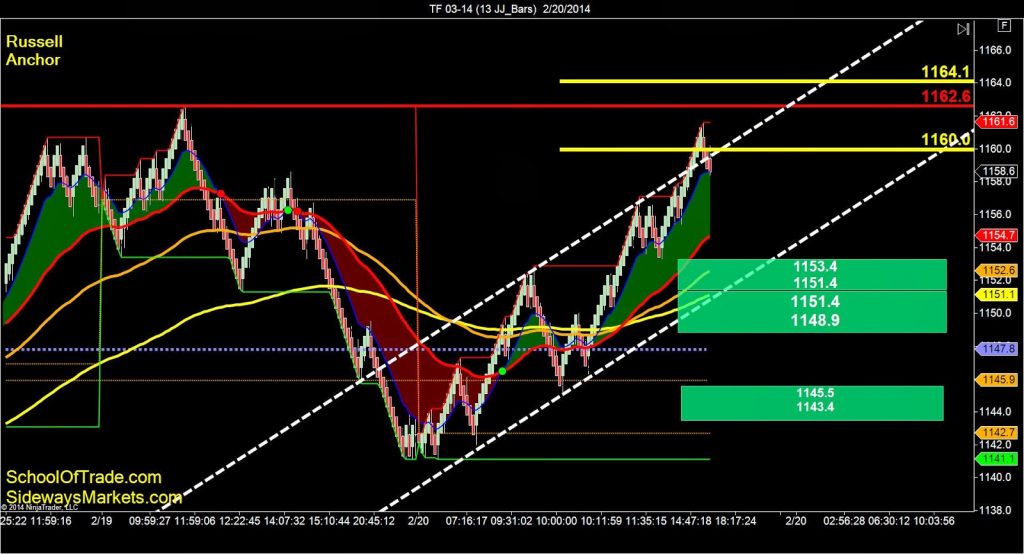 |
| Russell 13 Anchor Chart |
The 13-anchor chart of the Mini-Russell shows us the most
useful information for day trading this evening and into tomorrow morning. First, the bullish price channel tells us to
look for buying opportunities near the lows of the price channel. Second, we can easily see that price-action is
“overbought” or “priced at a premium” right now so we want to wait for price to
move lower into a position where we can buy at a discount.
comes off these highs…perfect location for buying opportunities will be at the
lows of this price channel around the 1153.4 area.
Click here to register for the
Free Trial!
Computer do the trading
trade Crude Oil
trade Euro
E-Mini Russell
Gold