January 30, 2014
- in Uncategorized by schooloftrade
3 Reasons I’m Bullish the US Markets | Day Trading Newsletter 01/30/14; SchoolOfTrade.com

“In
essence, if we want to direct our lives, we must take control of our consistent
actions. It’s not what we do once in a while that shapes our lives, but what we
do consistently.”
Reflections from Today:
·
We
NAILED these levels for today, made great money!
We
NAILED these levels for today, made great money!
·
Markets
Reacting to FOMC this morning, volatility was high
Markets
Reacting to FOMC this morning, volatility was high
·
Today’s
GDP sends equities soaring higher!
Today’s
GDP sends equities soaring higher!
·
Gold;
opened < PLOD so we sold short
Gold;
opened < PLOD so we sold short
·
Gold
moves lower -1.95% @ 1243.0
Gold
moves lower -1.95% @ 1243.0
·
Crude
Oil; Opened > PHOD so we got long
Crude
Oil; Opened > PHOD so we got long
·
Crude
Oil moves higher +.60% @ 98.08
Crude
Oil moves higher +.60% @ 98.08
·
Mini-Russell;
Opened > PHOD so we got long
Mini-Russell;
Opened > PHOD so we got long
·
Mini-Russell
moves higher +1.13% @ 1132.5
Mini-Russell
moves higher +1.13% @ 1132.5
·
Jobless
Claims came out higher @ 348k vs. 330k
Jobless
Claims came out higher @ 348k vs. 330k
·
GDP
came out as-expected @ 3.2% (highest since 2010)
GDP
came out as-expected @ 3.2% (highest since 2010)
·
GDP: Govt. Shutdown cost US 0.3% in Q4’ 2013
GDP: Govt. Shutdown cost US 0.3% in Q4’ 2013
·
GDP: Personal Consumption & Government
Spending tumbled
GDP: Personal Consumption & Government
Spending tumbled
·
Pending
Home Sales lagged; blame it on the weather!
Pending
Home Sales lagged; blame it on the weather!
·
Friday: Personal Income News @ 8:30am EST
Friday: Personal Income News @ 8:30am EST
·
Friday: Consumer Confidence News @ 9:55am EST
Friday: Consumer Confidence News @ 9:55am EST
·
Janet
Yellen takes the reigns of US Fed 9:00am Feb 3rd
Janet
Yellen takes the reigns of US Fed 9:00am Feb 3rd
·
Facebook
stock soars today, giving E-Mini Nasdaq a boost, advertising revenue jumps +76%
stock soars today, giving E-Mini Nasdaq a boost, advertising revenue jumps +76%
·
Happy
New Year! Solar New Year / Chinese New
Year tomorrow @ Midnight
Happy
New Year! Solar New Year / Chinese New
Year tomorrow @ Midnight
Economic News for Tomorrow:
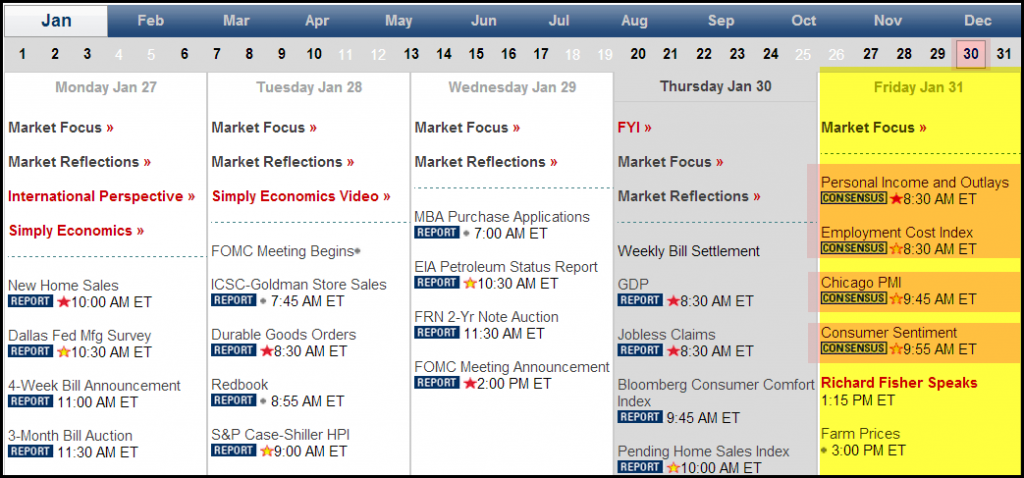 |
| Friday’s News Schedule |
8:30am EST Personal
Income | Employment
Costs
9:45am EST Chicago
PMI
PMI
9:55am EST Consumer
Sentiment
Sentiment
Friday is the end of the month and
the end of the solar New Year, and with some Red-Star news scheduled to be released early
in the session we are expecting to have another exciting trading day tomorrow.
the end of the solar New Year, and with some Red-Star news scheduled to be released early
in the session we are expecting to have another exciting trading day tomorrow.
We begin with Red-Star news from
Personal Income at 8:30am EST, which is exactly what we need to get the price-action moving
on a Friday morning. In addition, we
will also see news from Employment Costs at the same time.
Personal Income at 8:30am EST, which is exactly what we need to get the price-action moving
on a Friday morning. In addition, we
will also see news from Employment Costs at the same time.
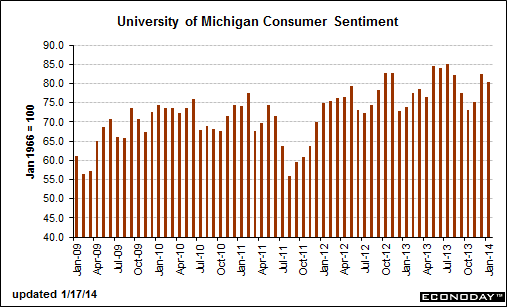 |
| Consumer Sentiment News |
Later in the session tomorrow we have
Chicago PMI and then Consumer Sentiment just before 10:00am EST.
If you recall, consumer confidence on Tuesday this week was VERY strong,
and last month (December) was a record-breaking number as well. The consumers in the US are bullish and
tomorrow we will see if that is likely to continue.
Chicago PMI and then Consumer Sentiment just before 10:00am EST.
If you recall, consumer confidence on Tuesday this week was VERY strong,
and last month (December) was a record-breaking number as well. The consumers in the US are bullish and
tomorrow we will see if that is likely to continue.
A Word of Caution…
Friday’s are
always going to be a moving target from the moment the session begins. People do strange things in the markets on a
Friday, especially at the end of the month and the year. We always want to finish our week in the
positive and bring that momentum into next Monday, which means we are going to
protect capital first tomorrow, and keep our eyes open for trading
opportunities early in the session.
Tomorrow we will trade the US session
from 7am to 12pm EST, and we will not trade the afternoon unless absolutely necessary.
from 7am to 12pm EST, and we will not trade the afternoon unless absolutely necessary.
Day trading plan for Tomorrow:
Crude Oil:
VIP Chart:
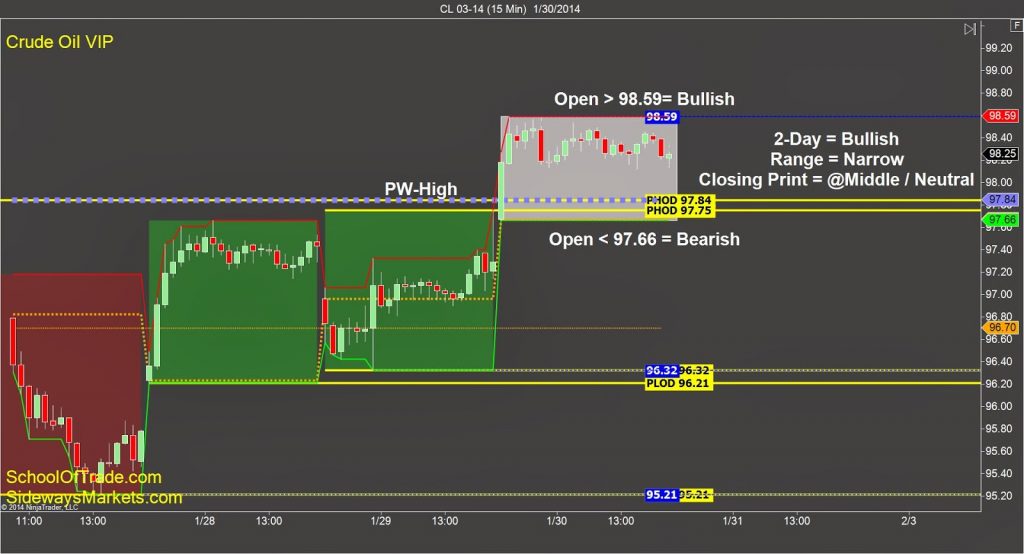 |
| Crude Oil VIP Chart |
Crude Oil is looking very bullish this evening on the VIP
chart after we opened the session at the highs and never looked back. The closing-print this afternoon was in the
middle of the range, so there’s a chance we move lower on Friday, but I am going
to wait to see what the opening-bell looks like.
chart after we opened the session at the highs and never looked back. The closing-print this afternoon was in the
middle of the range, so there’s a chance we move lower on Friday, but I am going
to wait to see what the opening-bell looks like.
 |
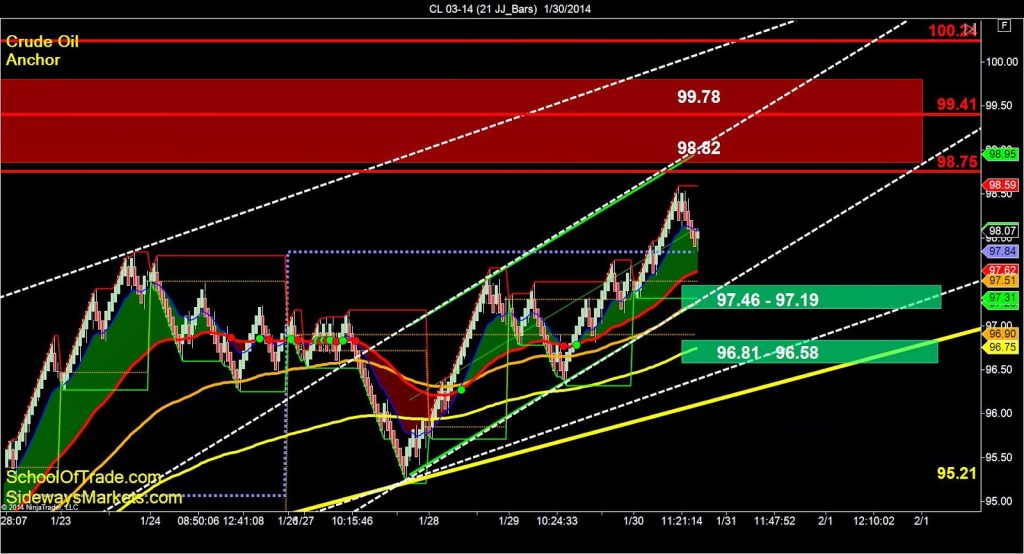
| Crude Oil Anchor Chart 1 |
I am selling short with
the opening-print below 97.66, and buying long with the opening-print above
98.59.
the opening-print below 97.66, and buying long with the opening-print above
98.59.
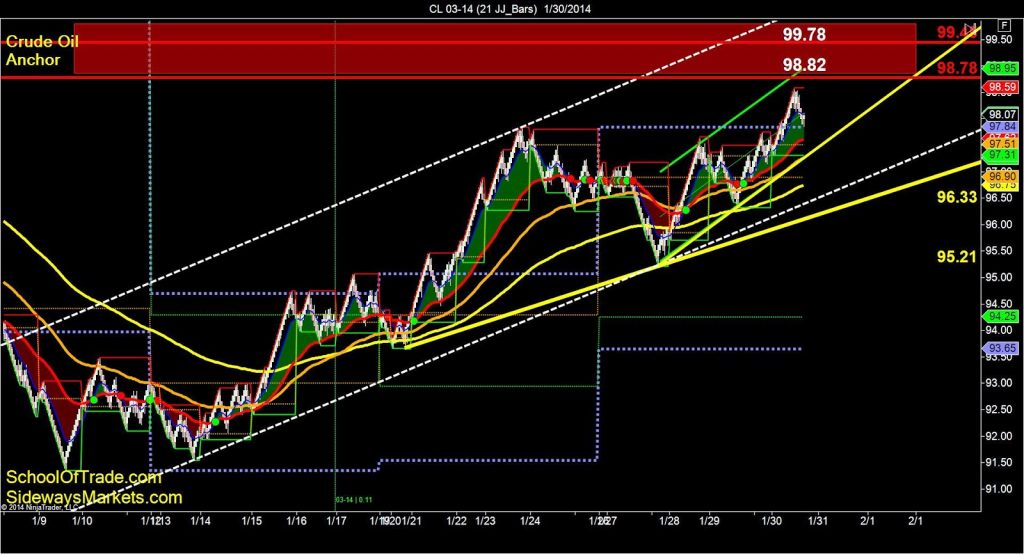
Anchor Chart:
The anchor chart is also very bullish on Crude Oil this
evening, and we are seeing an easy window of opportunity for Crude Oil to reach
the 100.00 big-round-number in tomorrow’s trading session.
evening, and we are seeing an easy window of opportunity for Crude Oil to reach
the 100.00 big-round-number in tomorrow’s trading session.
 |
| Crude Oil Anchor Chart 2 |
We are above all the key moving-averages, higher-highs and higher-lows
in price, and in a perfect location right NOW to buy this market at a discount
on the way up to the big-round-number of 100.00.
in price, and in a perfect location right NOW to buy this market at a discount
on the way up to the big-round-number of 100.00.
I am looking to buy on
a pullback to 97.46 or 96.81 and will use the 98.75 and 100.00 as my profit-targets
for tomorrow.
a pullback to 97.46 or 96.81 and will use the 98.75 and 100.00 as my profit-targets
for tomorrow.
Gold:
VIP Chart:
| Gold VIP Chart |
Just like we said last
night… if gold opens below the lows we are going to SELL OFF BIG… and look what
happened today… ended down almost 2%.
The VIP Chart looks bearish this evening, but the closing-print
in the middle of today’s range tells me that tomorrow is an open book as far as
direction goes so we will stick to the plan and trade with the opening-bell tomorrow
morning.
in the middle of today’s range tells me that tomorrow is an open book as far as
direction goes so we will stick to the plan and trade with the opening-bell tomorrow
morning.
I am selling short
tomorrow with an opening-print below 1233.5, and I am buying long with an opening-print
above the 1251.6.
tomorrow with an opening-print below 1233.5, and I am buying long with an opening-print
above the 1251.6.
Anchor Chart:
The anchor chart of gold leaves the door wide open for both
sides to have a chance to take control of price-action on Friday.
sides to have a chance to take control of price-action on Friday.
| Gold Anchor Chart 1 |
We can see a long term bullish price channel on the anchor chart
and we are testing the lows of this price channel as we speak around
1240.0. We can also see support below us
at 1230.6 which tells us the sellers are going to have to work hard to get this
price to drop easily tomorrow.
and we are testing the lows of this price channel as we speak around
1240.0. We can also see support below us
at 1230.6 which tells us the sellers are going to have to work hard to get this
price to drop easily tomorrow.
| Gold Anchor Chart 2 |
The easiest way to
trade Gold on Friday will be to wait for price to move higher up to the sell-zones
overhead at 1254.1 and 1263.5. The ideal location to
sell short will be at these levels tomorrow because we will be selling when
price is at a premium.
trade Gold on Friday will be to wait for price to move higher up to the sell-zones
overhead at 1254.1 and 1263.5. The ideal location to
sell short will be at these levels tomorrow because we will be selling when
price is at a premium.
Mini-Russell:
VIP Chart:
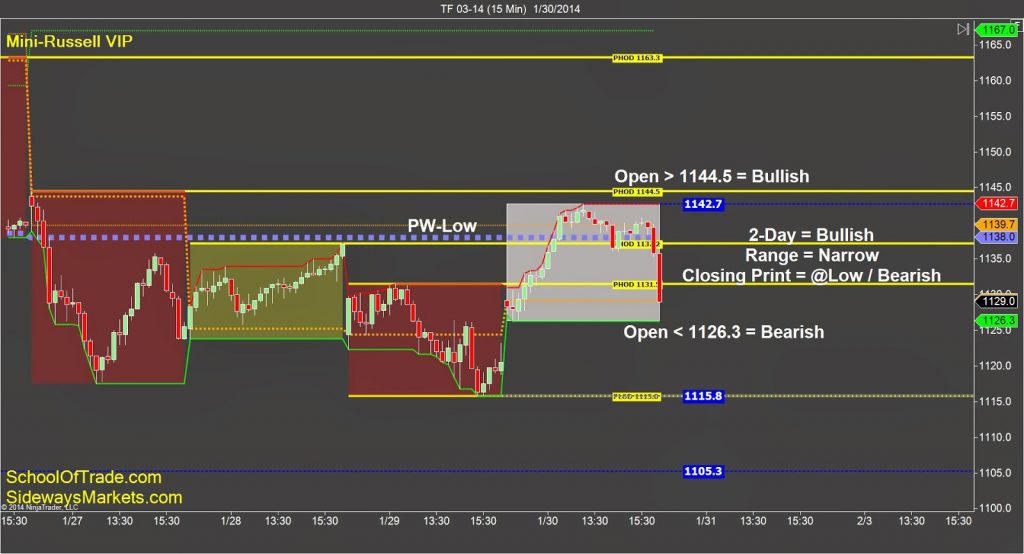 |
| Russell VIP Chart |
The Mini-Russell has
been on a roller-coaster the last week and this evening we can see how sideways
this market-personality has really been.
been on a roller-coaster the last week and this evening we can see how sideways
this market-personality has really been.
We have a bullish 2-day relationship, but at the same time we
saw a bearish closing-print this afternoon which tells us that ANYTHING can
happen for tomorrow.
saw a bearish closing-print this afternoon which tells us that ANYTHING can
happen for tomorrow.
I am going to sell
short tomorrow with an opening-print below the 1126.3, and I will buy long with
an opening-print above the 1144.5.
short tomorrow with an opening-print below the 1126.3, and I will buy long with
an opening-print above the 1144.5.
Anchor Chart:
The Anchor chart of the Mini-Russell shows us trading
sideways in the short term with a long-term-trend that is still bullish.
sideways in the short term with a long-term-trend that is still bullish.
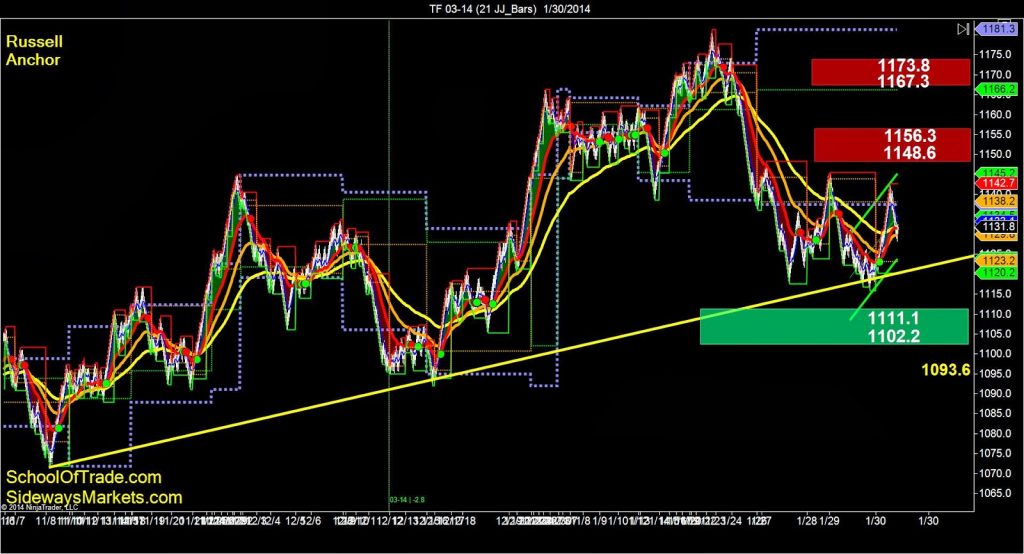 |
| Russell Anchor Chart 1 |
We have some major levels of support below us on the anchor chart
at the trend-line around 1120.0 and then more support down at 1111.1 and the big-round-number
of 1100.00. This support is likely to interrupt
this falling market…but the buyers don’t have it much easier if you look
closer.
at the trend-line around 1120.0 and then more support down at 1111.1 and the big-round-number
of 1100.00. This support is likely to interrupt
this falling market…but the buyers don’t have it much easier if you look
closer.
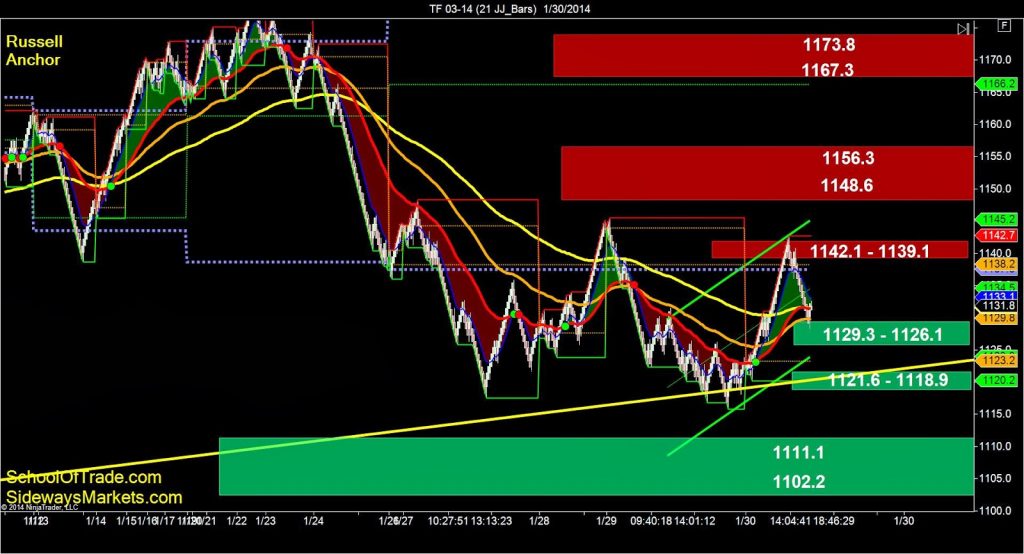 |
| Russell Anchor Chart 2 |
A closer look of the anchor chart shows us lots of support below
and resistance above which tells us that Friday may be a range-bound market if
the buyers and sellers can’t take control early in the session.
and resistance above which tells us that Friday may be a range-bound market if
the buyers and sellers can’t take control early in the session.
My goal for Friday is
to sell short when price gets below 1118.9 and use the 1100.0 big-round-number as
my profit-target. I will buy long when price gets above the
1142.1 and use 1148.5 and 1156.3 as my profit-targets.
to sell short when price gets below 1118.9 and use the 1100.0 big-round-number as
my profit-target. I will buy long when price gets above the
1142.1 and use 1148.5 and 1156.3 as my profit-targets.
===========================================================
Want to see us trade LIVE?
Click here to register for the
Free Trial!
Click here to register for the
Free Trial!
Automated Trading Strategy; Let the
Computer do the trading
Computer do the trading
Are you a Crude Oil Trader? Click here to
trade Crude Oil
trade Crude Oil
Are you a Euro Trader? Click here to
trade Euro
trade Euro
Are you an E-Mini Russell Trader? Click here to trade
E-Mini Russell
E-Mini Russell
Are you a Gold Trader? Click here to trade
Gold
Gold
Join the Premier Live trade-room as an Advanced Member