June 1, 2011
- in Uncategorized by schooloftrade
3 Clues from Crude, Gold & Dollar Make Easy Profits


Coming back from a vacation, the most important thing was getting back into the rhythm of my DAILY routine.
First thing I do is make sure I have food, sleep, my personal items under control.
Second thing is to open those charts and re-acclimate to where we are.
(your emotions should be going nuts! Get me going! We need to trade!! I don’t know where to trade right now!)
815am est
We have very interesting news from ADP employment this morning, confirming what we thought was happening last week.
“48k new service industry jobs”
“-10k goods-producing jobs”
We were on the track of lower manufacturing, fewer durable goods orders, and the threat of inflation from the fed comments last week.
This further paints a picture for us to form an opinion later this morning, this week, this month, this quarter.
900am est
We review the dollar index and we notice a new short term BEARISH trend after seeing new lows broken on the DX 89-range chart.
We marked up support levels below us and we will use this new info to help our trades on the markets we trade most.
We use a faster timeframe (34range) on the DX 06-11 to see the bearish price channel, and also that we are trading sideways at the lows of the sideways range.
This tells us the dollar is looking for clues for future direction, so anything is possible, but if we had to chose, the SHORT DOLLAR will mean better LONG trades on Gold, Crude, Euro, Russell, etc.
We will be watching where this dollar index goes very closely.
Is this chop due to low volume from the Holiday or is this from lack of confidence in direction?
We notice the DX 34range, 13range both have their BMT’s above them, and since we are at the lows of the major sideways range, we expect price to want to rise off these lows.
Tough to tell right now where it will go. We can see good reasons for a rise and a fall, now we wait.
(what is my plan of attack if the dollar rises, or falls? What will I do?)
930am est
We wait for the US market to open and we wait for more speed and ‘personality’ to enter the market.
Let’s review the Crude Oil Chart:
89range chart shows us a break above the sideways range, and we are trading sideways above it.
· Will we drop back in
· will we rise up to test the next resistance at 105.06
· or will we go sideways still
We also notice the bullish price channel, and we will use the 34 and 13 range charts to plan the channel more specifically.
Our plan of attack on Crude Oil:
Break above 103.39 and we need to consider this bull channel the real deal, and lets start buying pullbacks.
We also know that if price below 100.92 it will signal a change in trend and we will start to sell the highs of the wedge and the channel, the target is the lows of the wedge/channel. The BMT may be an easier target.
We know that we do NOT have any CAD news today or the rest of the week.
We do NOT have inventories today at 1030am est like we usually do, so we expect to see the traders sit on hands and wait for tomorrow. At the same time, we’re concerned that tomorrow those same traders may not be comfortable with trading outside of what they normally do.
We expect low volume on crude oil today and tomorrow, and then finishing the week with a bang after Non farm payrolls.
We see the PHOD is above us, and the PLOD is below us, making this an inside trading day.
Buy the lows and sell the highs, expect the market to trade INSIDE this range as a higher % trade.
Find the sideways range and wait to buy the lows and sell the highs.
“Fade the levels, rather than looking for breakouts”
If price rises:
· im selling at resistance first, then buying new higher highs with pullbacks.
· Never buying at the highs.
· sell the highs of the short term wedge in blue trend lines
· avoid the OPEN 102.90
· sell the highs of the wedge
· above 103.39 im buying pullbacks, assuming this is now a bullish trending market inside the bull channel
if price falls:
· I will buy at support first, and then sell retracements with new lower lows.
· I will not sell at the lows
· I will avoid the trend line highs of the channel (very sloppy) and the big round number of 102.00
· buy the lows of the sideways range at 101.81, but beware of this sloppy big round number.
· Sell retracements with new lower lows below 101.81, looking for the BMT at 101.21 as the target.
· Avoid trading around the BMT at 101.21, which is also the Previous OPEN
· Buy the PLOD as support 100.92 and then sell new lower lows with a retracement.
· I will buy the lows of the price channel.
· I will buy the support below the price channel around 100.00, but beware that price level is DANGEROUS! BRN 100.00
· Buy 99.60 as major support if price can get down that far.
1115am est
We review the Gold Futures for the following:
– Outside day, so we’re buying pullbacks and selling retracements when we see new higher highs or lower lows
– PHOD and PLOD are below us, along with the BMT and the OPEN. All of these are price magnets, which means if the buyers aren’t strong enough to push new highs we may see them fail and price will tumble back DOWN into the range BELOW us.
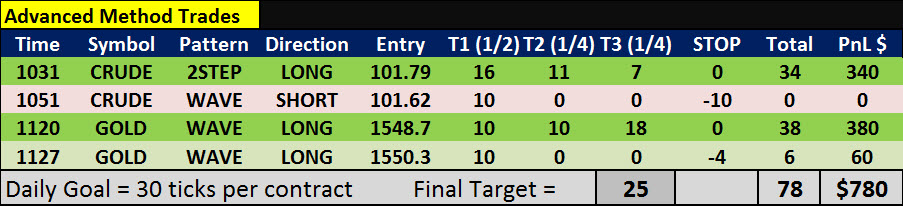
In review of our day today, it looks like the half the volume in the market caused the sloppy price action.
We did our best to make lemonade with the lemons we have.
Outside day on gold, we bought new HH’s with pullbacks, but very sloppy.
Inside day on Crude Oil, so we bought the lows and never got another chance.
1000am est
News is out lower than expected on the ISM Manufacturing Index, and as expected for construction spending.
The dollar has not moved yet as of 10:05 so we wait…