- in Uncategorized by schooloftrade
100+ Ticks LIVE Today. Easy way to AVOID this Chop in the market.

830am EST
o Average true range has been dropping since early this week so we have a very big concern that the OTHER MARKETS we trade may be slow and sluggish b/c of this ATR reading
– WE see the dollar index futures at their highs, so we look for a DX pattern to the short side on the dollar but we have multiple levels of support to worry about.
o We have less than 15 ticks of room for the dollar to move down, so we will wait for the dollar to test the HOD again and look for an entry trigger closer to the highs
845am EST
– Crude oil futures are also trading sideways with a wedge pattern formed from our trend lines
o Average true range is rising off its lows, however, its still lower than it was earlier this week
o We noticed that we have lots of support as far down as 71.65, so look for us to break below that level for the highest percentage trades.
Today’s market environment is choppy, sideways, range-bound, so how should we trade it?
– Use a slower timeframe to avoid the ‘noise’ that comes with a choppy market
o Trending days = faster timeframe
When its choppy we want to be more selective and only take the best trades
950AM EST
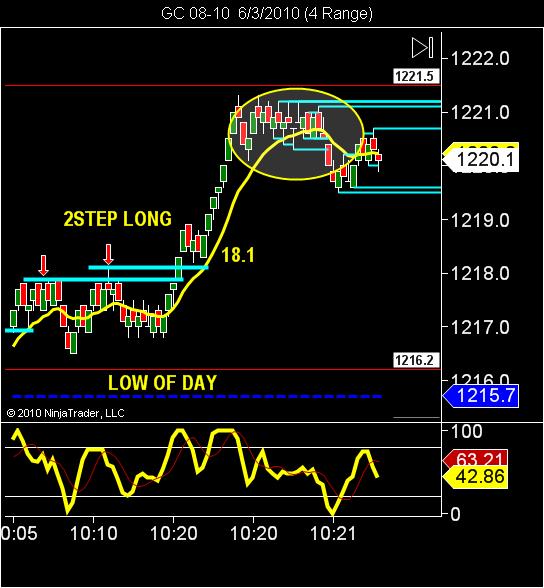
– Watching gold futures set up for a breaker pattern on both the 4 range (fast for scalpers) and a 13-range (little slower for day traders) however, the speed in the market is VERY slow, POT < 100
o We will wait to see the 13 range pattern trigger for a longer term hold.
– I’m scanning the markets looking for patterns
o Slowest charts (34 range) show me where the most important levels are
o Then look at the faster charts for different patterns, they are the SAME patterns on ANY market, ANY timeframe, ANYTHING goes
o Start with my faster charts first…
4-range….nothing there…
8-range….nothing there…
13-range…nothing there…
30-min…
60-MIN…we notice we are right in the middle, and our perfect pattern needs to occur NOT in the middle, but rather at the extremes.
– Lower volume = opportunity for manipulation
1045AM EST
Only 4 contracts needed to achieve this today!
See you tomorrow @ 745am EST for the live trade room session!