July 26, 2012
- in Uncategorized by schooloftrade
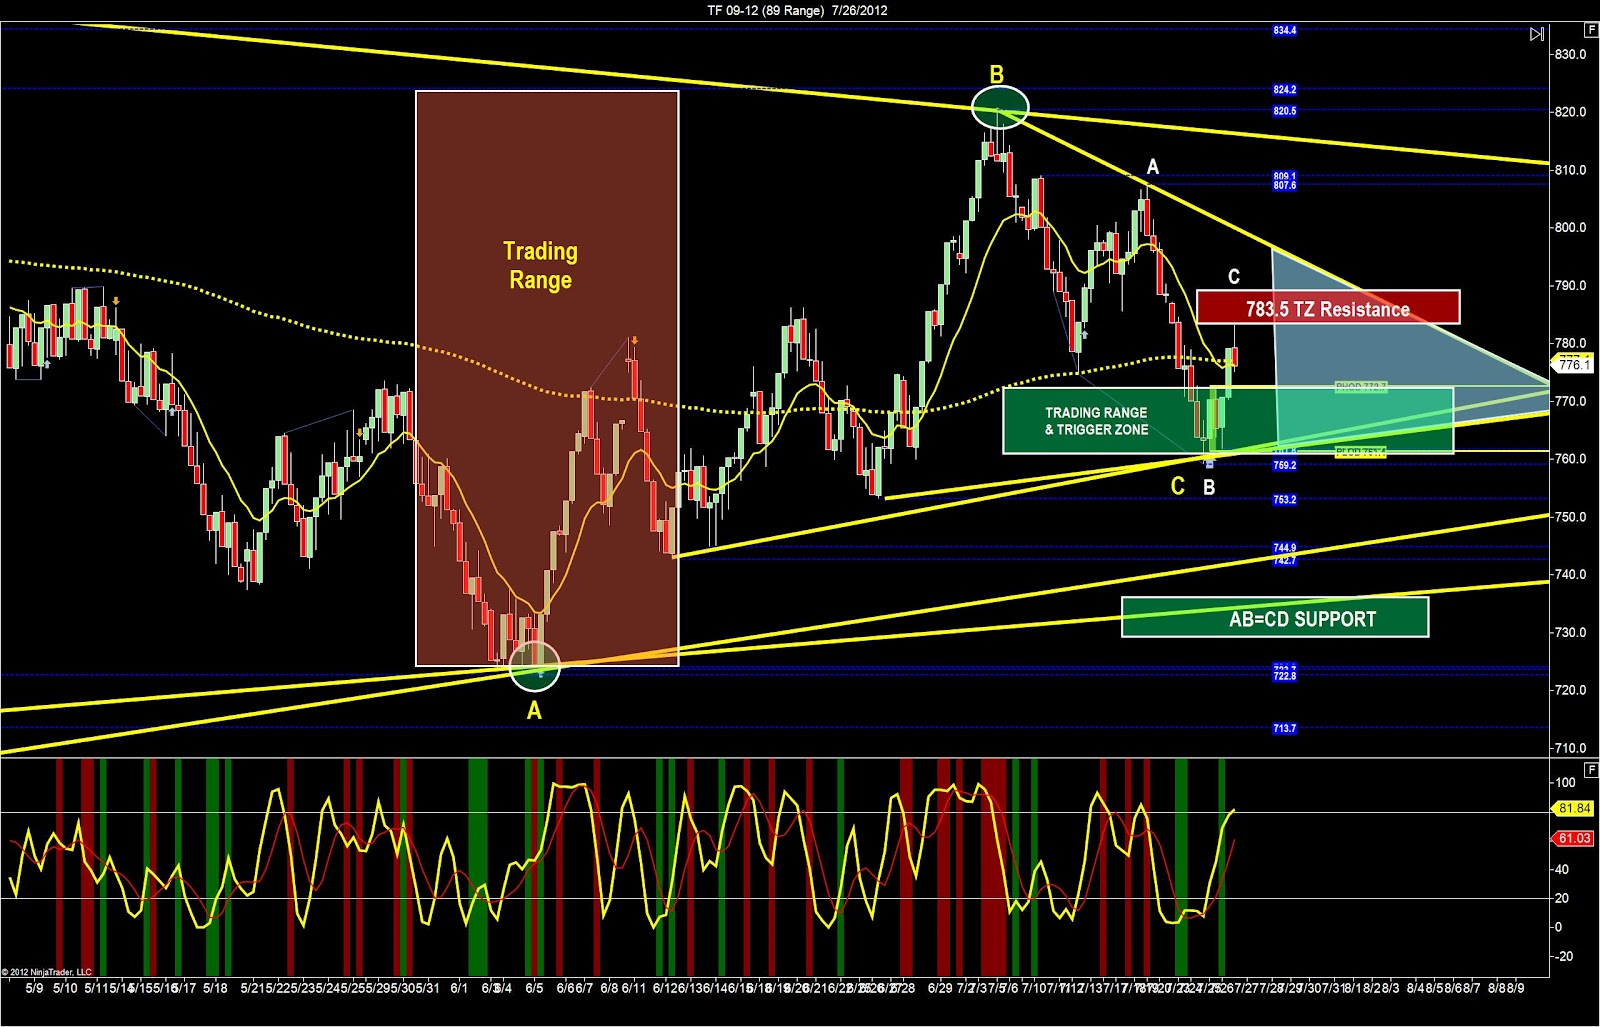
E-Mini Russell Chart Prep

 Heat
HeatMap: What is it telling us?
Bullish heat
map
map
OHLC
Analysis:
Analysis:
2 out of 4
are confirming. This is mixed, so no
directional bias.
are confirming. This is mixed, so no
directional bias.
Overnight
Highs & Lows:
Highs & Lows:
Above the
overnight highs so we’re bullish
overnight highs so we’re bullish
Are we
inside or outside day today?
inside or outside day today?
Outside day,
above PHOD. Bullish market personality,
but open to anything.
above PHOD. Bullish market personality,
but open to anything.
What
price-structures do we see?
price-structures do we see?
· Price wedge is there, we have many of
them, so buy the lows and sell the highs
them, so buy the lows and sell the highs
· Price channel does not exist on this
chart
chart
· Trigger-zone located below us as
support and above us as resistance. We
can sell short below the PHOD because its also the highs of the trigger-zone
below us.
support and above us as resistance. We
can sell short below the PHOD because its also the highs of the trigger-zone
below us.
· AB=CD Pattern is bullish in the short
term, and bearish in the long term.
term, and bearish in the long term.
· Zigzag is not on this chart today
· Double-top / Double-bottom are not on
this chart today.
this chart today.
Range Highs and Lows we can see marked in the
rectangle